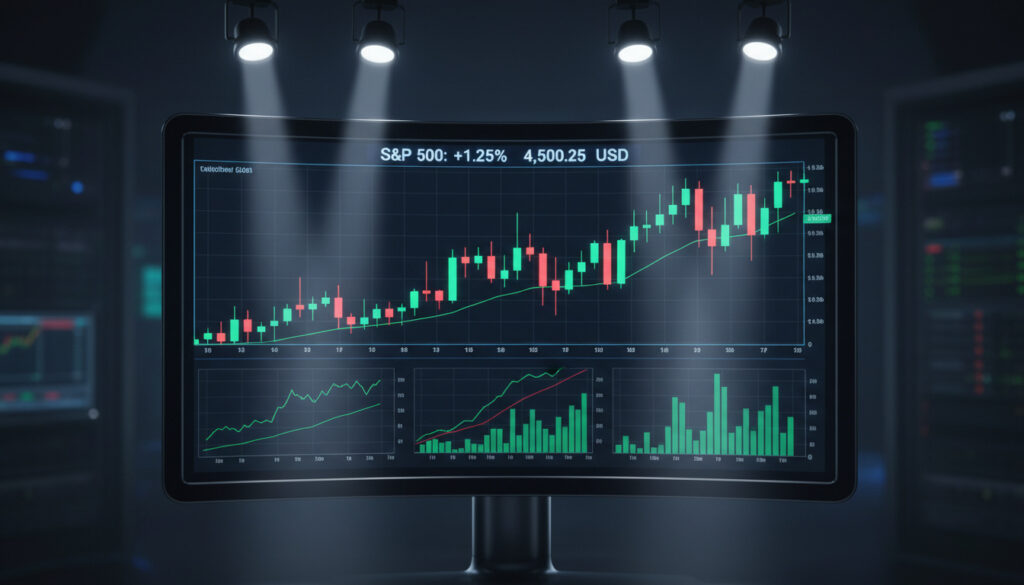
S&P 500 Live – Current Value, Chart and Insights
The S&P 500 closed at 6,701.43 on March 16, 2026, marking a 1.04% advance as equity markets responded to easing energy prices. The session added approximately 67 points to the benchmark index, pushing year-to-date gains to 17.39% despite recent monthly volatility.
Intraday trading saw the index oscillate between a low of 6,685.93 and a high of 6,726.18, reflecting sustained institutional activity throughout the session. The upward movement materialized even as geopolitical tensions in the Middle East persisted, with technology giants experiencing mixed performance while consumer staples showed relative strength.
Live tracking of the S&P 500 remains essential for portfolio managers and retail investors alike, offering real-time insight into the health of the American equity market. Current data feeds aggregate transactions from primary exchanges to deliver continuous pricing updates during official trading hours.
What is the Current S&P 500 Value?
Key Market Insights
- Energy Relief: The rally correlated with a pullback in crude oil prices, reducing inflationary pressure concerns.
- Tech Weakness: Major technology components including Meta (-3.83%), Broadcom (-4.11%), and Microsoft (-1.57%) declined significantly.
- Consumer Resilience: Walmart outperformed with a 0.95% gain, suggesting defensive positioning among investors.
- Volatility Compression: The VIX declined 1.06% to 26, indicating reduced fear sentiment despite geopolitical risks.
- Mixed Breadth: The Dow Jones Industrial Average fell 0.26% while the Nasdaq-100 gained 0.45%, creating divergence with the S&P 500’s broad rally.
- Treasury Pressure: US Treasury yields continued climbing during the session, typically a headwind for equity valuations.
S&P 500 Snapshot
| Attribute | Details |
|---|---|
| Ticker Symbol | ^GSPC / SPX |
| Components | 500 large-cap US equities |
| Calculation | Market-capitalization weighted |
| Primary Exchange | NYSE, NASDAQ |
| Trading Hours | 09:30–16:00 ET |
| March 16 High | 6,726.18 (intraday) |
How is the S&P 500 Performing Today?
Market Drivers and Economic Context
The March 16 session demonstrated the index’s capacity to advance against a complex macroeconomic backdrop. US Futures had indicated positive opening sentiment despite overnight escalations in Middle East conflicts. Trading Economics data confirmed the benchmark maintained momentum even as consumer sentiment indicators weakened amid Iran conflict concerns.
The day’s 1.04% gain corresponded directly with declining energy costs. When crude prices retreat, transportation and manufacturing sectors typically experience margin relief, while broader inflation expectations moderate. This dynamic particularly benefited industrial and consumer discretionary components within the index.
Comparative Index Performance
While the S&P 500 posted solid advances, market breadth revealed underlying selectivity. The Dow Jones Industrial Average retreated 0.26% to close at 46,696, underperforming the broader market. Conversely, the technology-heavy Nasdaq-100 managed a 0.45% increase to 24,491, though this lagged the S&P 500’s pace.
Small-cap equities represented by the Russell 2000 declined 0.36% to 2,480, suggesting risk-off positioning in more volatile segments. This divergence indicates institutional capital favored established large-cap liquidity over speculative growth names during the session.
S&P 500 Live Chart and Data
Real-Time Data Feeds
Accurate live tracking requires connection to primary market data providers. The official S&P 500 index calculates continuously during trading hours based on real-time transactions of constituent securities. S&P Dow Jones Indices maintains the methodology and component selection, while exchange infrastructure facilitates price discovery.
Data Reliability Considerations
Discrepancies occasionally emerge between data vendors regarding exact point changes. While Investing.com recorded the March 16 close at 6,701.43 with a 67-point gain, Trading Economics indicated a 28.55-point advance representing 0.43%. Such variations typically reflect different timestamps for “closing” calculations or adjustments for after-hours activity.
Investors monitoring 2000 Euros in Pounds – Live Rate and 2026 Trends should verify data timestamps when comparing S&P 500 movements against currency positions. Delayed quotes, common on free platforms, typically lag 15-20 minutes behind live executions.
What are S&P 500 Futures?
S&P 500 futures contracts allow market participants to speculate on or hedge against future index movements outside regular equity trading hours. The CME Group’s E-mini S&P 500 contract (ES) serves as the primary vehicle for this activity, trading nearly 24 hours daily.
Current research does not contain specific futures pricing data for March 16, 2026. While CME Group’s official platform provides real-time futures quotes, specific contract values, expiration dates, and open interest figures for the current session remain unverified in available sources.
Futures prices typically diverge from the cash index due to carrying costs, dividend expectations, and time decay. Premiums or discounts to fair value indicate market sentiment regarding overnight or weekend risk. Traders should note that futures trade in quarter-point increments, unlike the decimal precision of the cash index.
The relationship between futures and the live index becomes particularly relevant during pre-market hours, when futures pricing often predicts opening sentiment. However, without specific futures data for the current analysis period, direct correlations to the March 16 cash market performance cannot be established.
How Has the S&P 500 Moved Recently?
- : Index closed at 6,701.43, gaining 1.04% (67 points) with an intraday range of 6,685.93–6,726.18. Source: Investing.com
- : Alternative data sources recorded a 0.43% gain (28.55 points), highlighting potential vendor calculation differences. Source: Trading Economics
- Month-to-Date: The index declined 2.65% through mid-March, indicating recent consolidation before the March 16 recovery. Source: Trading Economics
- Year-to-Date 2026: Sustained upward trajectory with 17.39% gains through March 16, significantly outperforming historical averages. Source: Trading Economics
- Intraday High: 6,726.18 reached during March 16 session, establishing a new technical resistance level. Source: Investing.com
- Volatility Trend: VIX declined to 26, down 1.06% on the session, retreating from elevated fear levels. Source: Trading Economics
What S&P 500 Data is Definitively Established?
Verified Information
- Official closing value of 6,701.43 on March 16, 2026
- Session high of 6,726.18 and low of 6,685.93
- Year-to-date appreciation of 17.39%
- Regular trading hours: 09:30–16:00 Eastern Time
- Specific component declines: Meta (-3.83%), Broadcom (-4.11%), Microsoft (-1.57%)
- Walmart gain of 0.95%
Unverified or Incomplete Data
- Exact futures contract (ES) values for March 16
- Precise sector weightings contributing to the day’s move
- Real-time volume figures for constituent securities
- Exact calculation methodology discrepancies between data vendors
- After-hours trading volume and price action
- Specific component rebalancing effective dates
Why Does S&P 500 Live Tracking Matter?
The S&P 500 represents approximately 80% of available US market capitalization, serving as the primary barometer for American economic health. Unlike the price-weighted Dow Jones Industrial Average, the index’s market-capitalization methodology ensures larger companies exert proportionally greater influence on directional movements.
Institutional investors utilize live S&P 500 data to benchmark portfolio performance, adjust hedging strategies, and calibrate sector allocations. The index’s 500 constituents span eleven sectors, providing diversification that reduces single-stock volatility impact while maintaining sensitivity to broad economic trends.
For context on corporate events affecting constituent valuations, investors may review National Express Share Price – Delisted Status and 382p Buyout to understand how individual securities transition between public and private status, potentially impacting index composition.
Data Sources and Market Authority
Market data originates from regulated exchanges and verified financial data aggregators. Primary sources for the March 16, 2026 valuation include Investing.com and Trading Economics, with supplementary context from 247WallSt regarding oil price correlations.
The S&P 500 explodes on pullback in oil, gaining approximately 67 points as energy cost concerns ease amid geopolitical tensions.
247WallSt Market Analysis, March 16, 2026
For methodological details regarding index calculation and maintenance, S&P Dow Jones Indices provides comprehensive documentation on eligibility criteria, quarterly rebalancing procedures, and corporate action adjustments.
Key Takeaways on Current S&P 500 Performance
The S&P 500 maintains bullish momentum with a 6,701.43 close on March 16, 2026, advancing 1.04% despite mixed performance among technology mega-caps. While monthly trends showed weakness earlier in March, the 17.39% year-to-date gain reflects resilient equity markets navigating geopolitical tensions and rising Treasury yields. Investors monitoring live data should verify timestamp consistency across providers, particularly when comparing spot index values against futures or international indices.
Frequently Asked Questions
What companies are in the S&P 500?
The index comprises 500 large-cap US companies selected by S&P Dow Jones Indices based on market capitalization, liquidity, and sector representation. Current constituents include Walmart, Microsoft, Meta, and Broadcom, though specific weightings fluctuate with market prices.
How can I track S&P 500 live data?
Real-time tracking is available through brokerage platforms, financial data terminals like Bloomberg or Refinitiv, and free delayed-quote services from Investing.com or Trading Economics. For precise execution timing, professional traders require Level II market data subscriptions.
What is the historical performance of the S&P 500?
Through March 16, 2026, the index has gained 17.39% year-to-date. Monthly performance showed a -2.65% decline before the March 16 recovery. Long-term historical returns average approximately 10% annually including dividends, though individual years vary significantly.
What time does the S&P 500 open and close?
Regular trading hours for the New York Stock Exchange and NASDAQ, which determine S&P 500 pricing, run 09:30 to 16:00 Eastern Time Monday through Friday. Pre-market and after-hours sessions occur outside these times but show reduced liquidity.
How is the S&P 500 calculated?
The index uses a market capitalization weighting methodology. Each company’s market value (share price multiplied by outstanding shares) determines its influence on the index. The sum of these values is divided by a proprietary divisor adjusted for corporate actions.
Why did different sources report different point gains for March 16?
Data vendors may use different closing time conventions or adjustment methodologies. Investing.com reported a 67-point gain while Trading Economics indicated 28.55 points. Such discrepancies typically reflect distinct calculation timestamps or handling of after-hours activity.
More related posts
 Dessert Places Near Me in Dublin: Best Spots & Delivery Options
 I’m a Celebrity 2025 – Angryginge Crowned King of the Jungle
 Amy Childs: Net Worth, Children, Weight Loss, Cosmetic Surgery
 Arya Stark: Biography, Age, Relationships, and Endgame
 How to Apply for PIP – Step-by-Step UK Claim Guide
 Ruth Bradley: Biography, Weight Gain, Best Roles
 What Does a Panic Attack Feel Like – Symptoms, Duration and Coping Tips
 What Is NHS England? Role, Differences, and Abolition Explained